National Seminar · Assam University, Silchar · July 2026

Seeing landslides coming,
with a laptop and free data.

An AI early-warning framework for the Eastern Himalaya — fusing satellite imagery, terrain and 26 years of rainfall, validated against 420 real landslides. No supercomputer. No paid data. One student.

420documented landslides
26 yrsdaily rainfall
0.87cross-validated AUC
scroll ↓

The problem

Every monsoon, slopes fail. Almost none of them are watched.

Landslide early-warning systems operate in only 5 nations and 13 regions worldwide (Guzzetti et al., 2020) — and almost none of the Himalayan arc is covered. Worse, the standard tool, a national rainfall threshold, breaks down here: the Eastern Himalaya is so wet that an all-India threshold fires on most days, telling authorities nothing.

This project asks a simple question: with only free, public data and a consumer laptop, how far can AI get toward a usable early-warning map for this region?
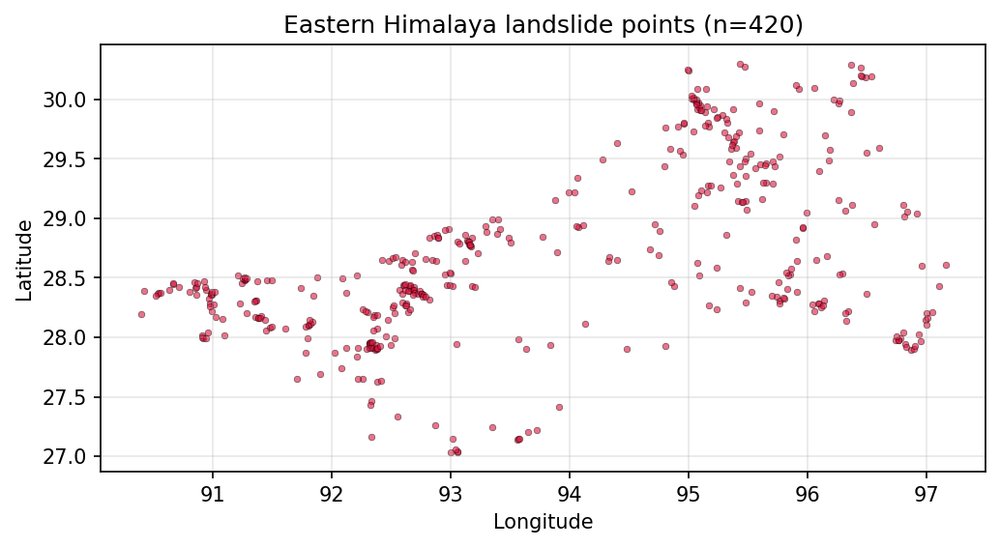
Scatter map of 420 documented landslide locations across the Eastern Himalaya
420 documented landslide locations, Eastern Himalaya (open Zenodo inventory, 2026)

The ingredients

Four free datasets, one feature table.

Sentinel-2 imagery

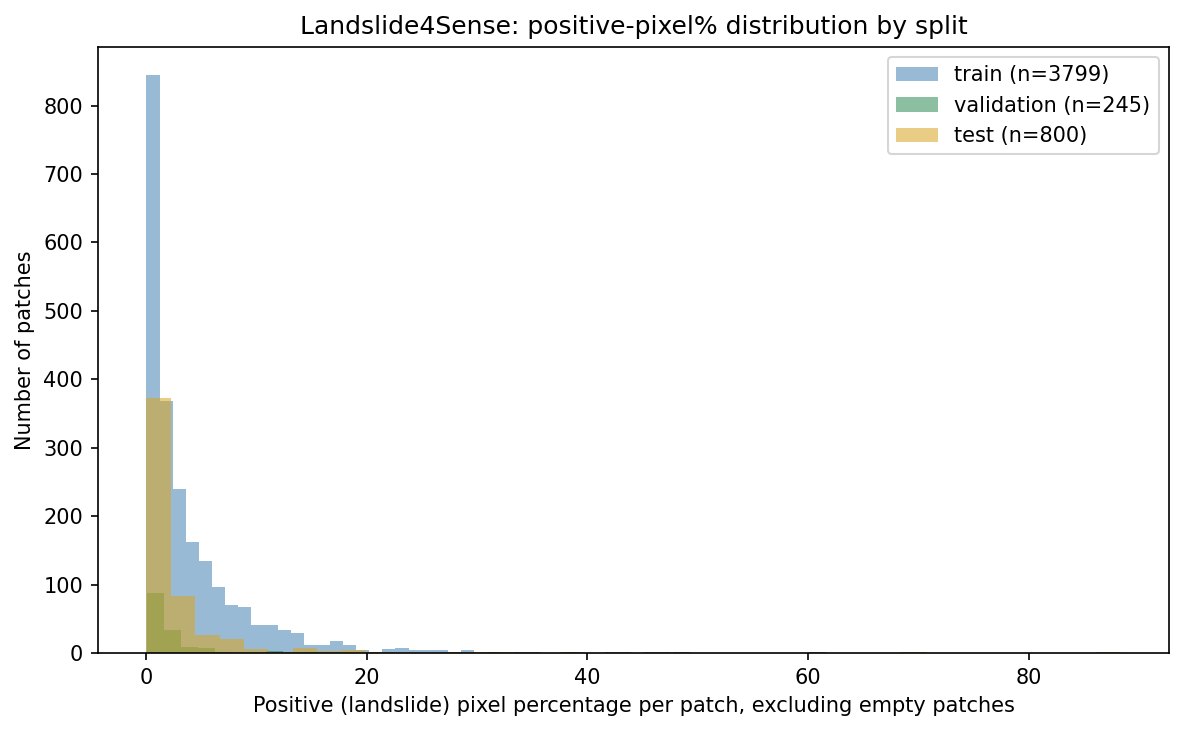
ESA satellite scenes packaged as the Landslide4Sense benchmark — 4,044 labelled patches, 14 bands each.

Trains the vision model

SRTM elevation

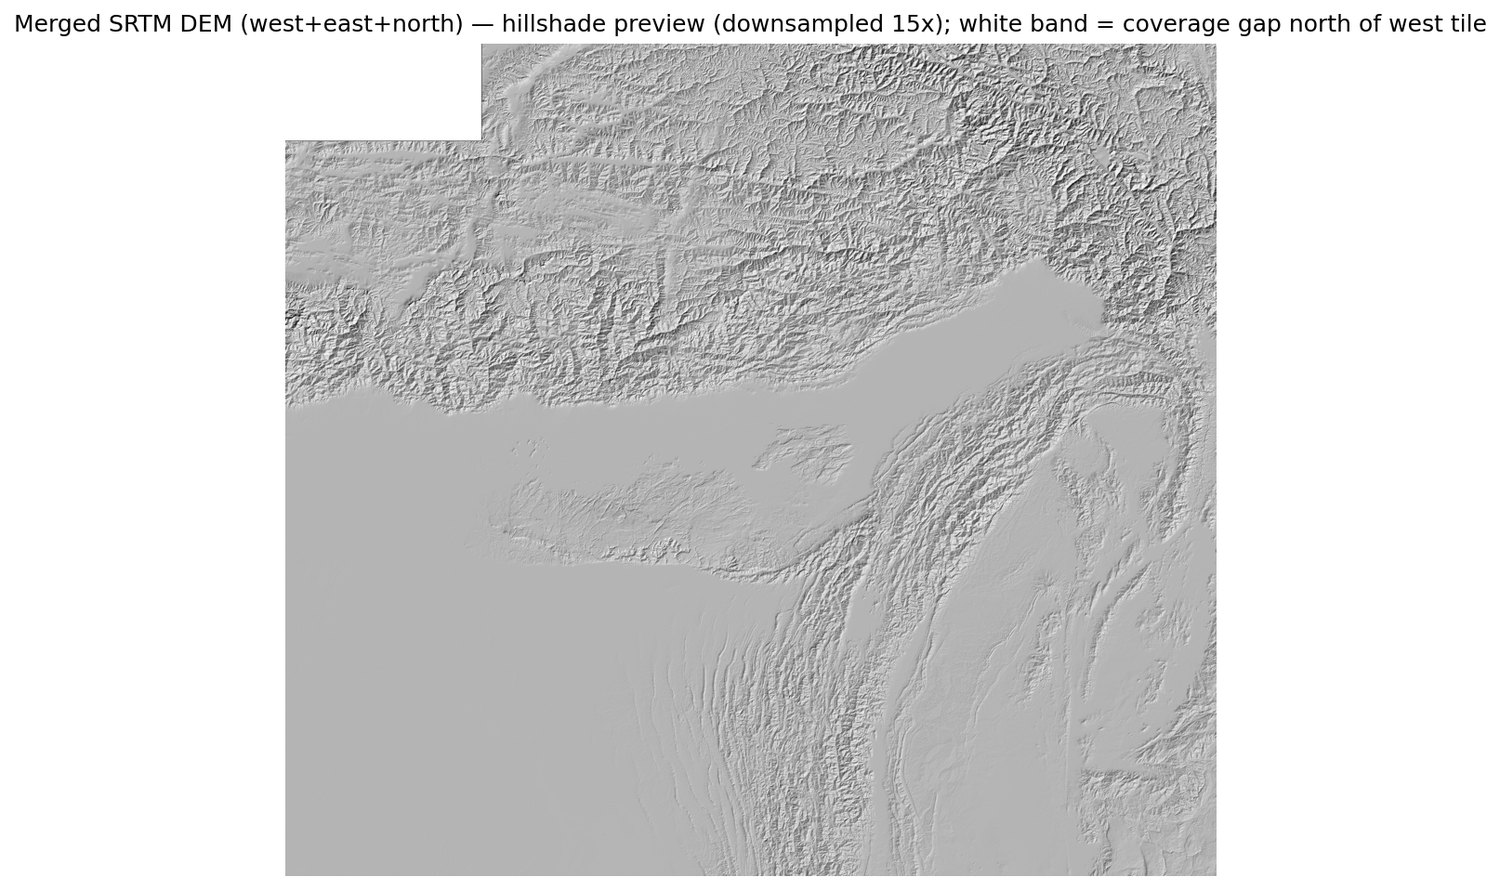
NASA 30 m terrain, three tiles merged to cover 88–97.5°E. Slope, aspect and ruggedness derived from it.

Terrain predictors

IMD rainfall

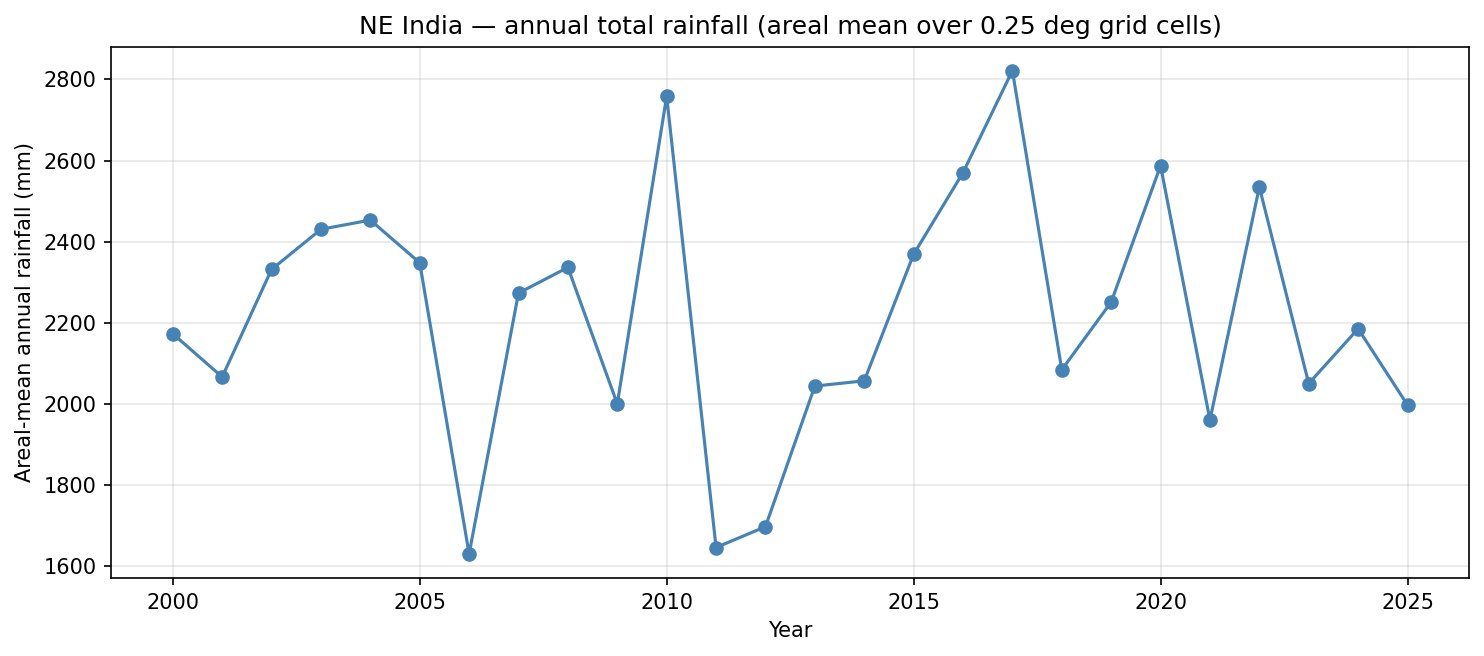
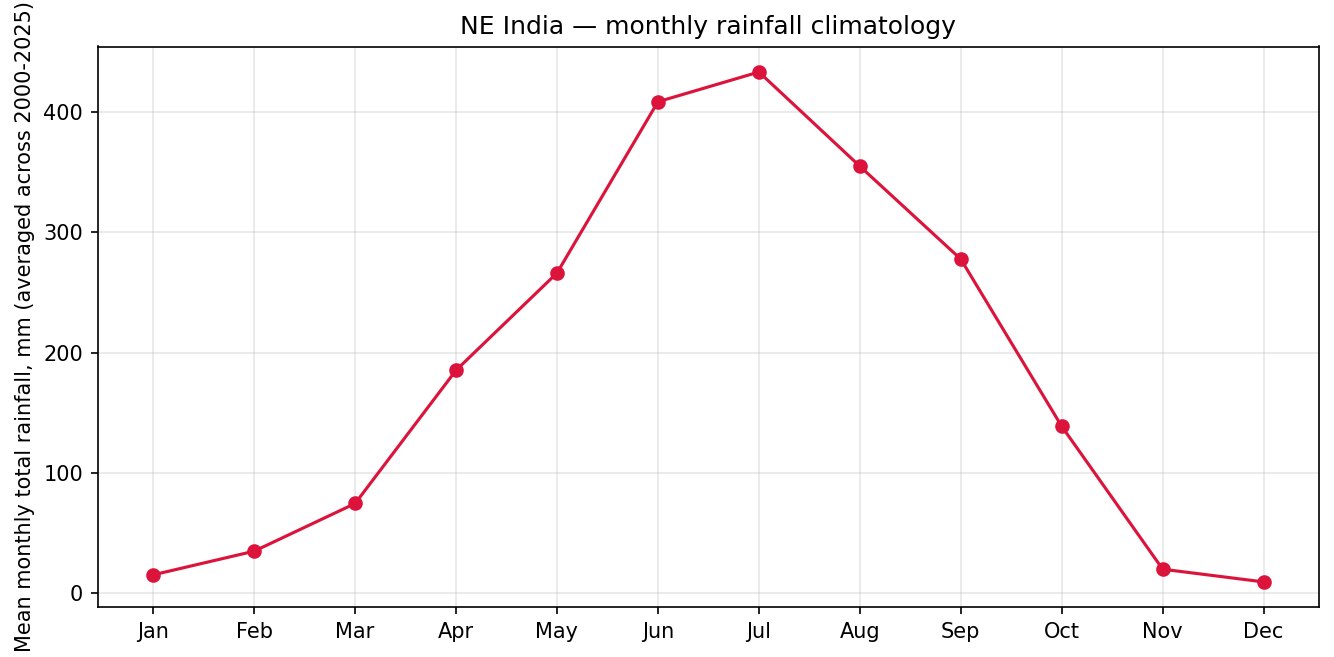
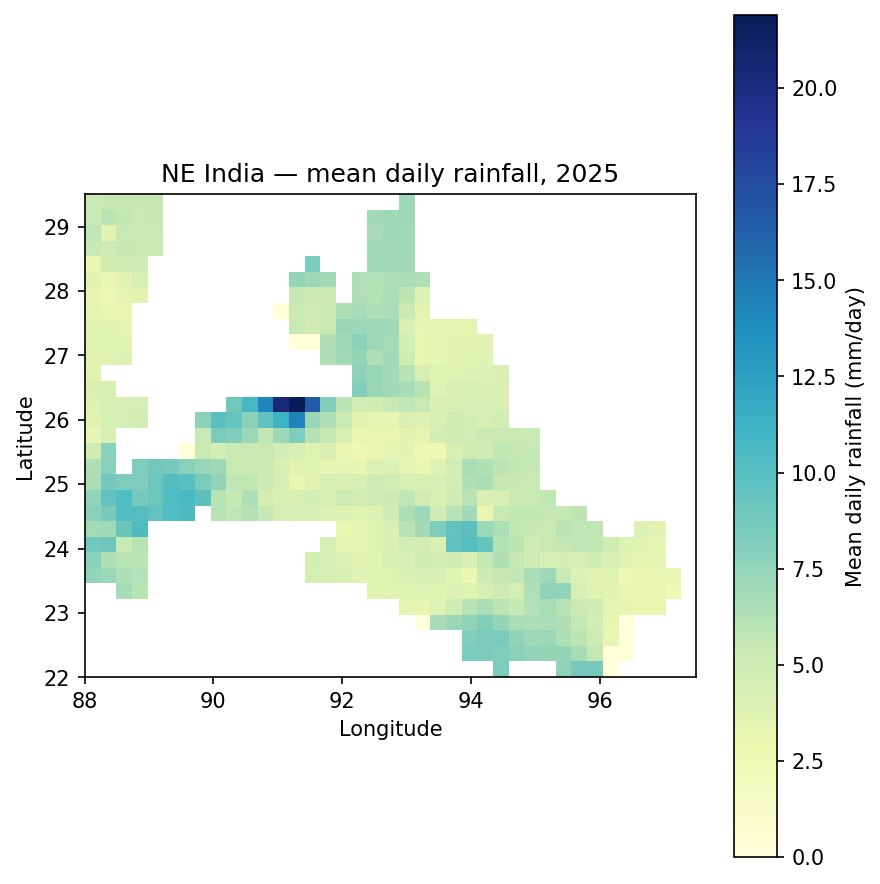
India Meteorological Department 0.25° daily grid, 2000–2025. Annual totals, monsoon peaks, wet-day frequency, 3-day extremes.

Rainfall predictors

Landslide inventory

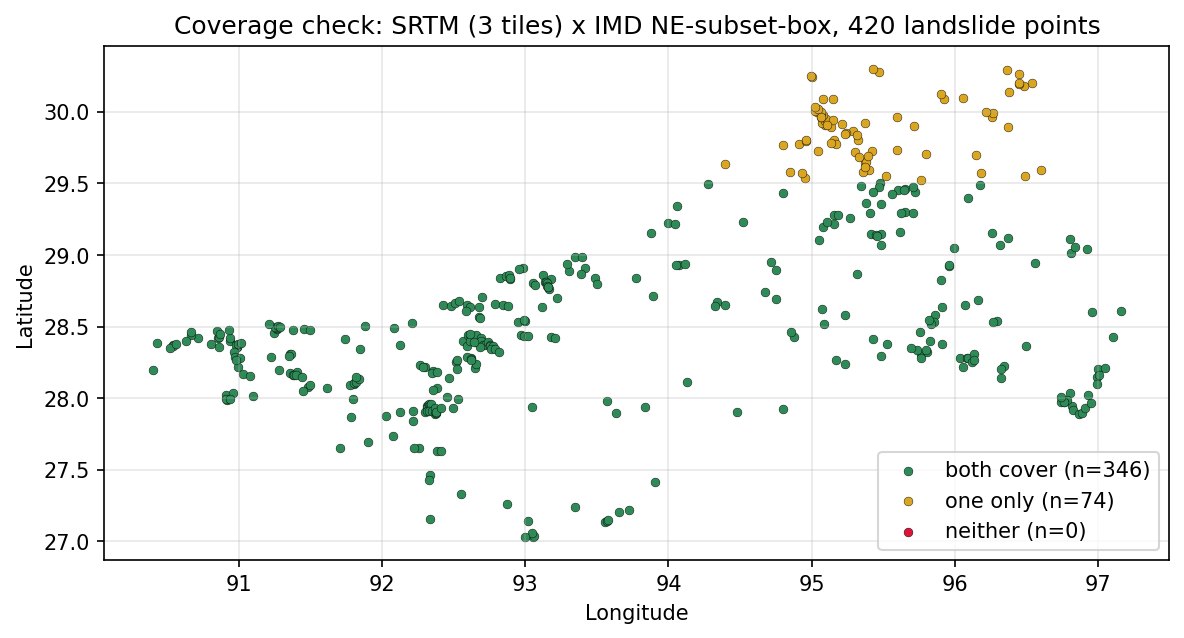
420 documented locations from an open Zenodo inventory — audited so every point falls inside both data layers.

Ground truth

Fusion in one sentence: every location on the map becomes an 8-number fingerprint — four terrain values + four rainfall values — and 420 landslide points plus 2,100 carefully sampled background points become the table the model learns from.

Exploring the raw data

Before a single model was trained, each dataset was audited end to end. These are the actual exploratory figures — click any to enlarge.

How it works

Three models, one risk score.

step 1 · vision

Find landslide scars from orbit

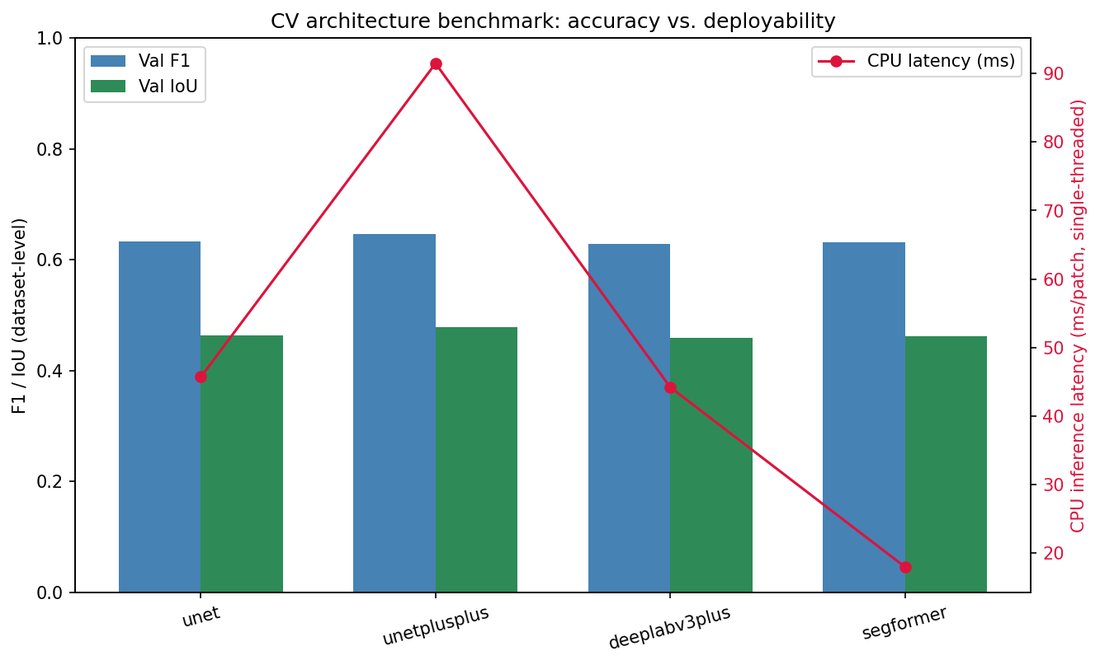
Four deep-learning architectures were benchmarked under identical training. U-Net++ won on accuracy (F1 0.65); SegFormer matched it within two points at 7× fewer parameters — small enough to run on an office laptop with no GPU.

step 2 · terrain + rainfall

Learn where slopes are dangerous

An XGBoost model — selected over LightGBM, Random Forest and Logistic Regression by cross-validation — turns the 8-feature fingerprint into a susceptibility score for every 90 m cell of the region.

step 3 · trigger

Check the rainfall trigger

The national rainfall threshold (Peruccacci 2017) is evaluated against 26 years of IMD data — and shown to over-fire in this hyper-humid belt, which is exactly the gap the terrain model fills.

fusion

One score, four alert tiers

The streams combine into a single 0–1 risk score, cut into low · medium · high · very high — the colour language district authorities already use.

trust

Every alert explains itself

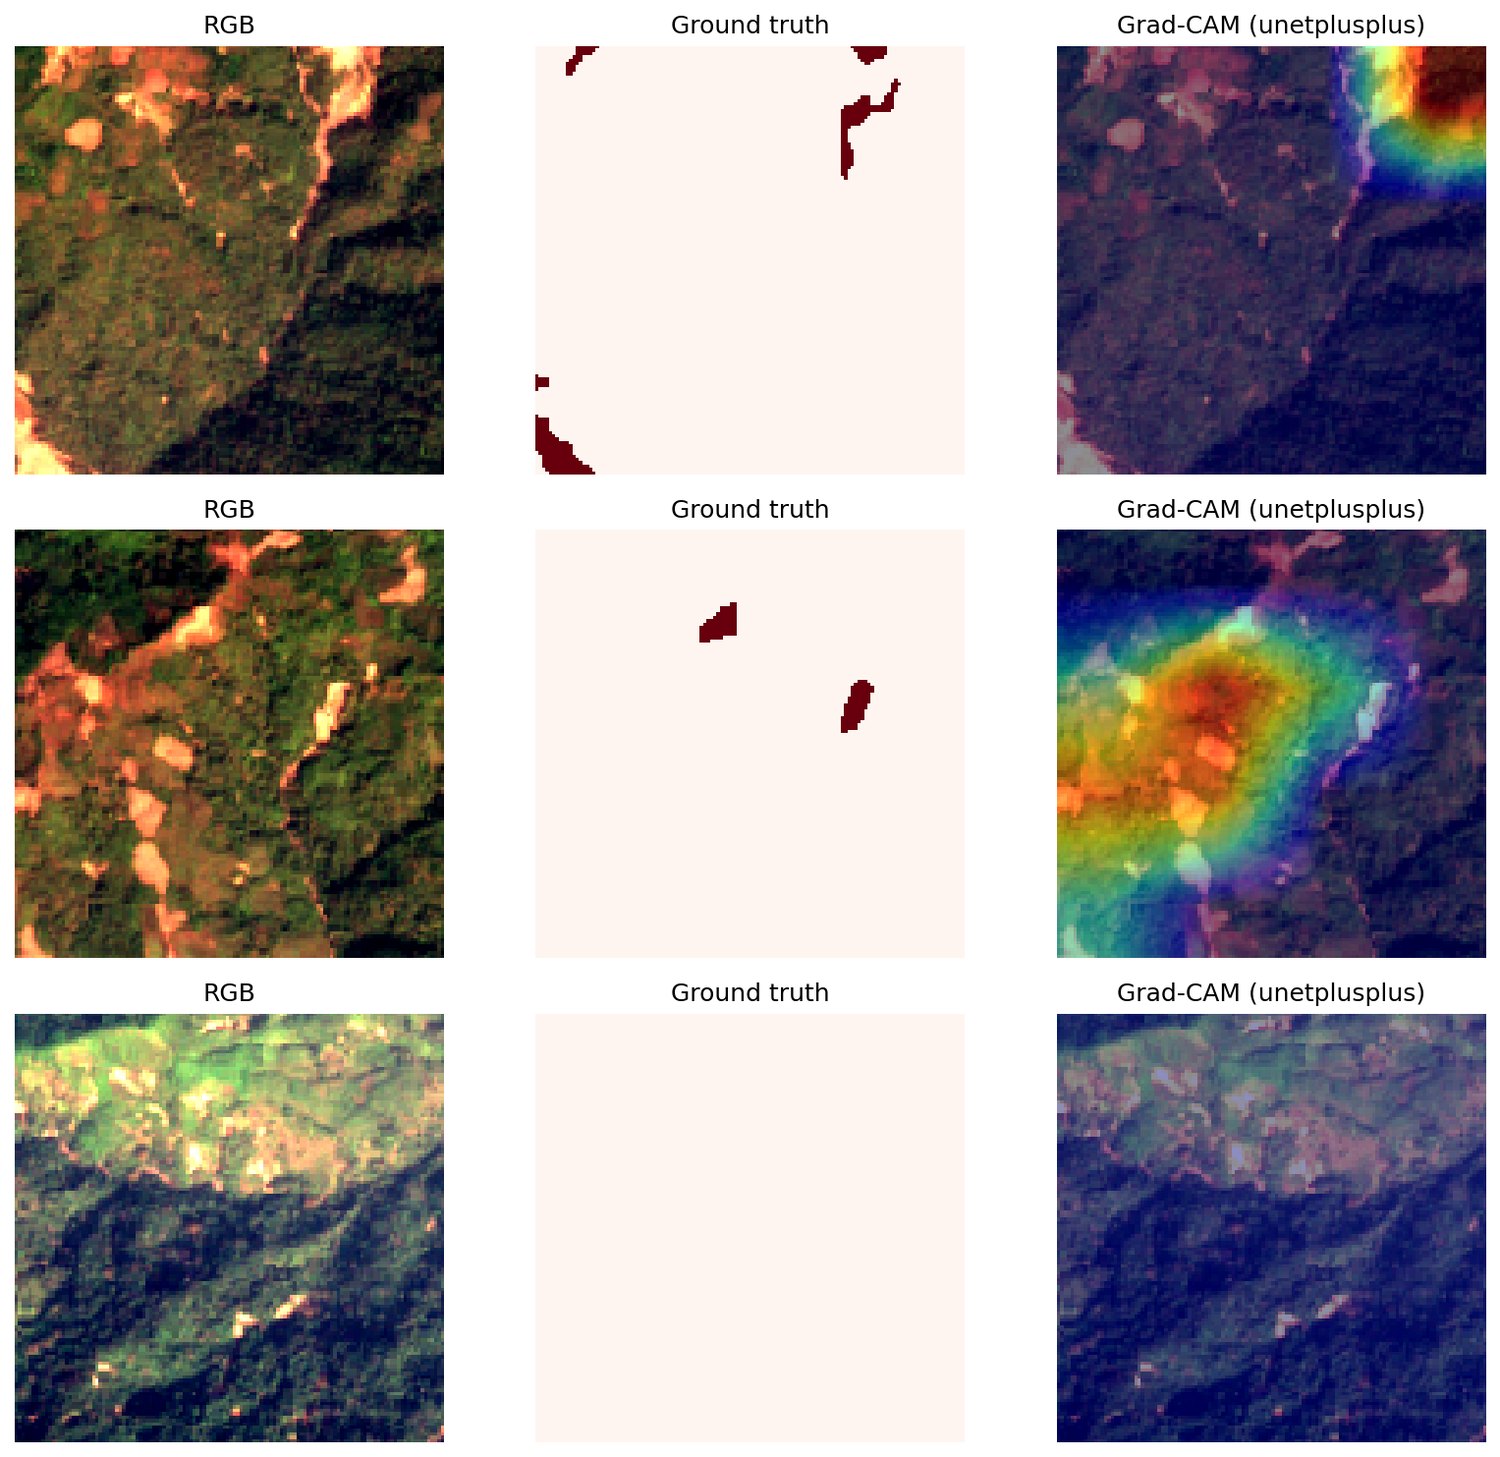
SHAP names the drivers, Grad-CAM shows where the vision model looked, MC-Dropout says how sure it is. An alert you can explain is an alert people act on.

What the AI sees. Drag the divider.

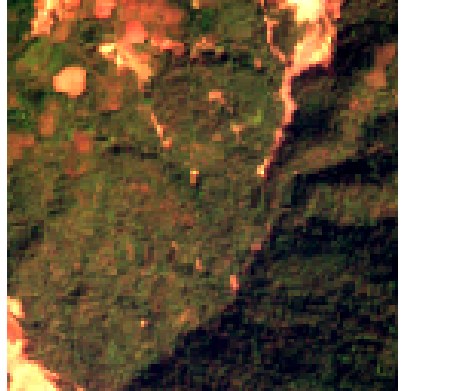
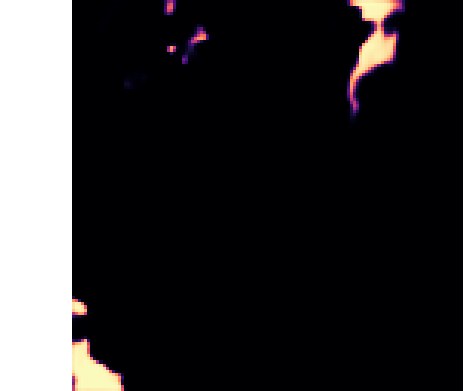
Bright regions mark where the model believes a landslide scar is — compare against the scars visible in the raw satellite view.

Sentinel-2 satellite view of a Himalayan slope with visible landslide scars
Model probability heat-map highlighting the same landslide scars
satelliteAI prediction
Bar chart benchmarking four segmentation architectures on accuracy and CPU latency
Accuracy vs. deployability across four architectures. SegFormer: 18 ms per patch on a single CPU thread.

Headline result

A 90-metre risk map of the Eastern Himalaya.

0cross-validated AUC — honest, held-out score
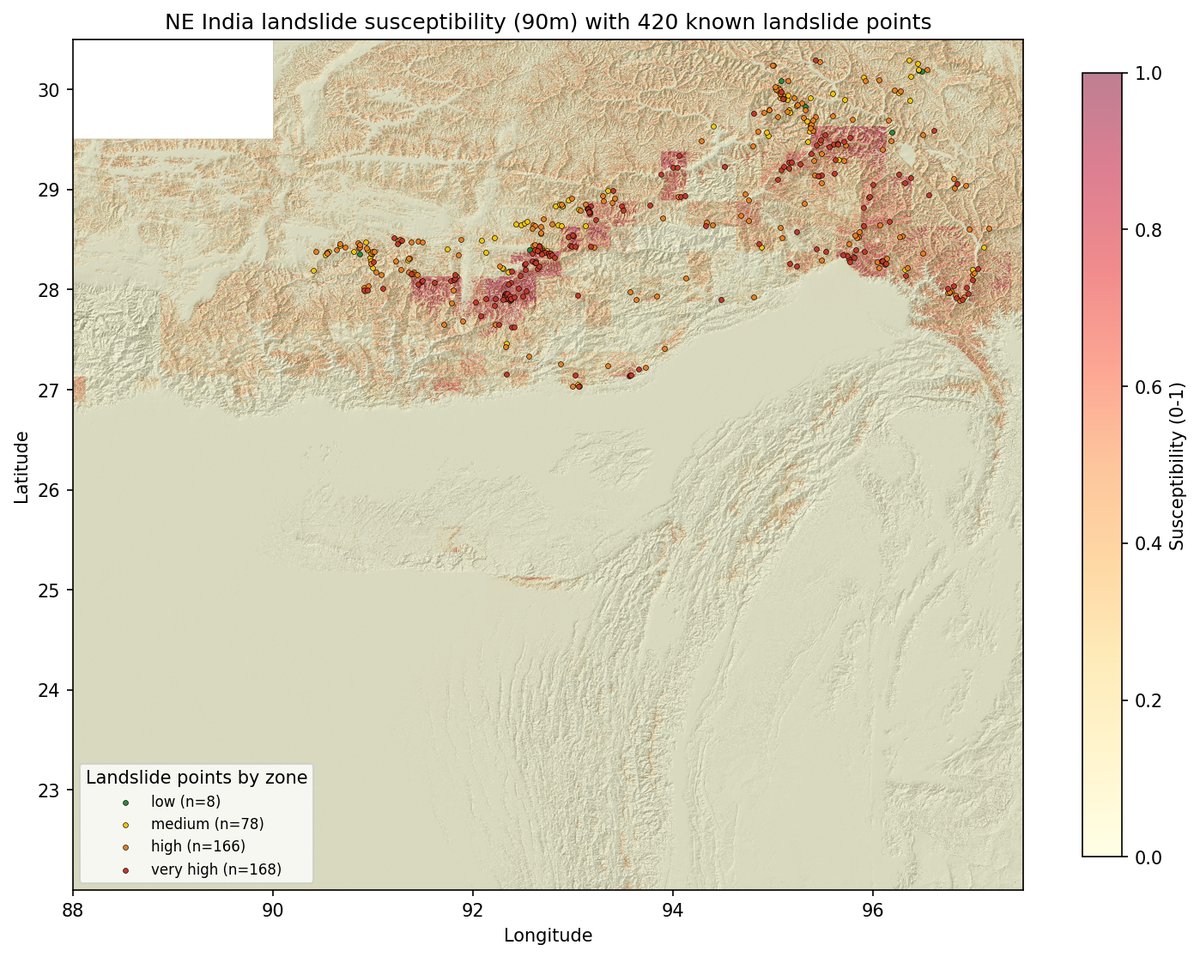
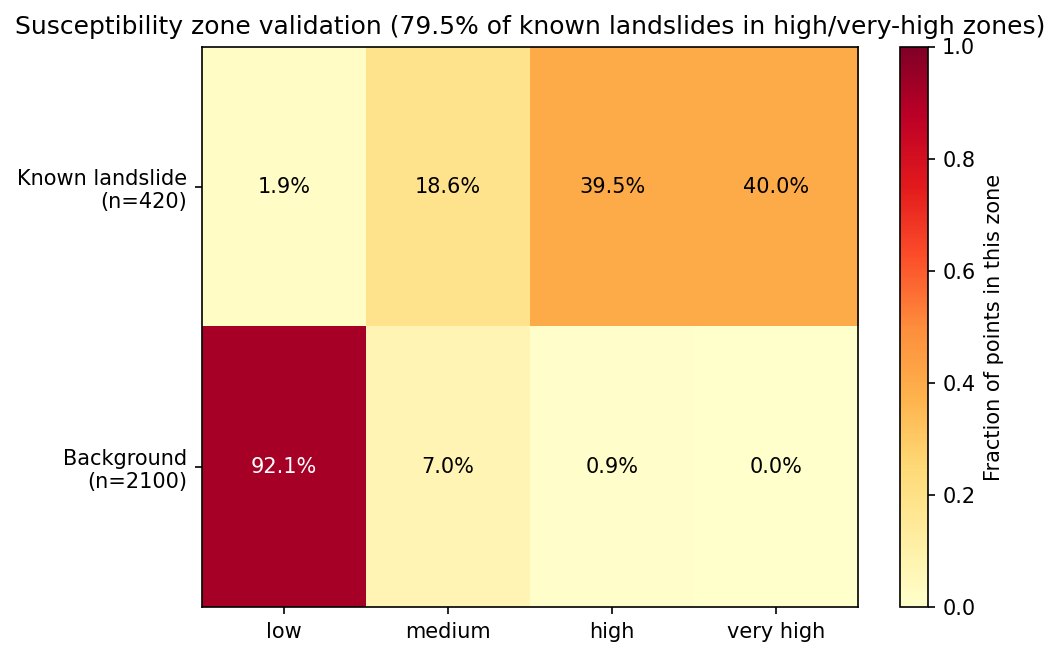
0%of the 420 known landslides fall in high / very-high zones
0%fall in the "low" zone — the map rarely misses a real site outright
Susceptibility map of Northeast India with 420 landslide points overlaid, risk concentrated along the Himalayan front
Susceptibility at 90 m with all 420 landslides overlaid, coloured by predicted zone. The Brahmaputra floodplain correctly returns near-zero risk — the model learned terrain, not artefacts.

Does the map actually work?

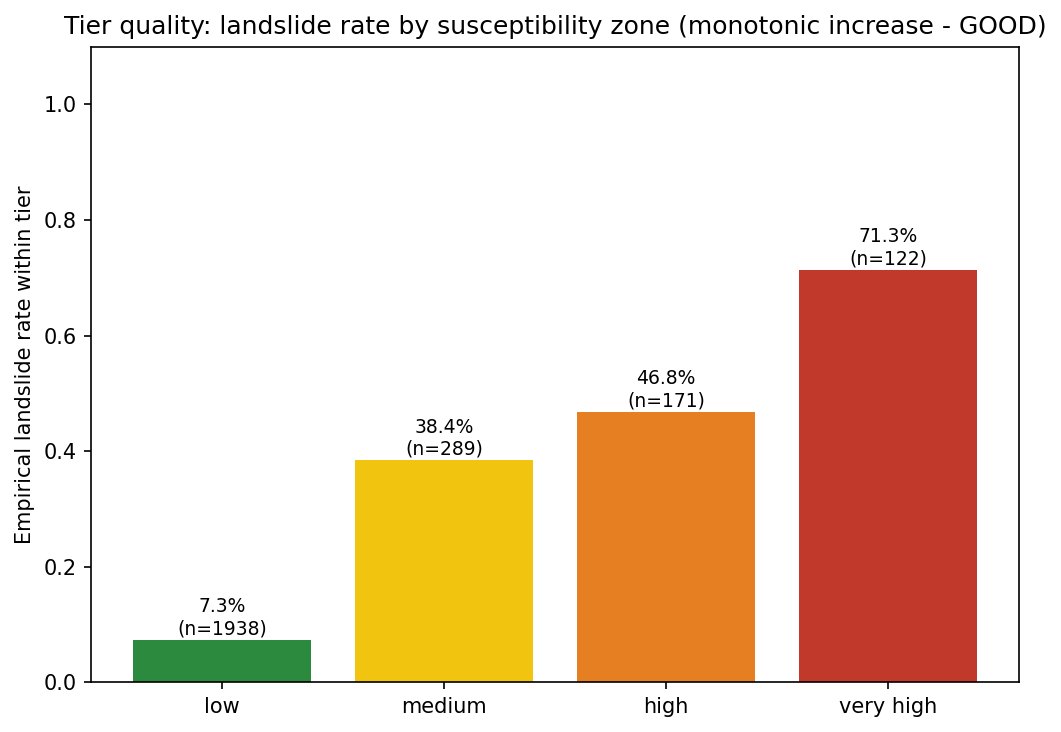
Two independent validations: known landslides should pile up in the dangerous zones, and each tier's real landslide rate should climb in order.

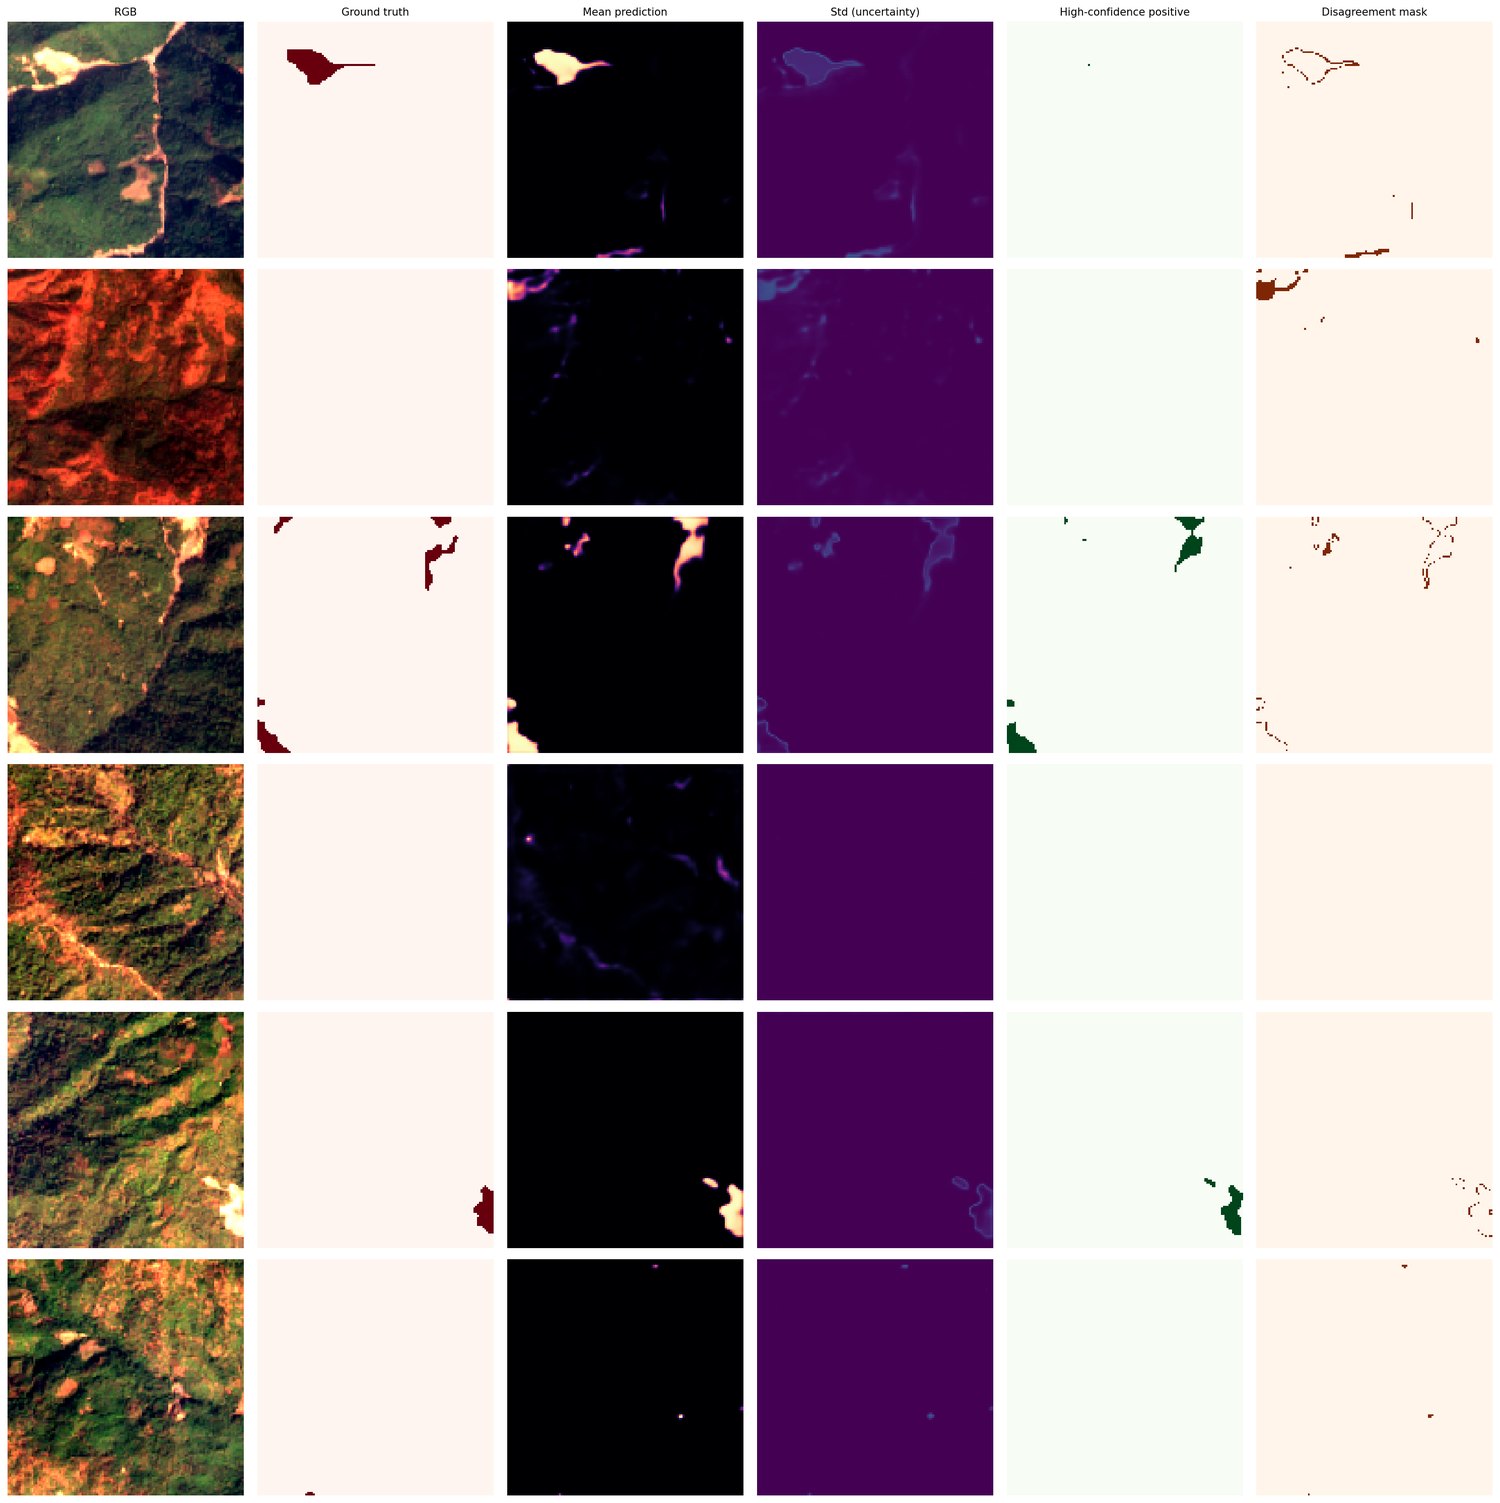
Segmentation, patch by patch

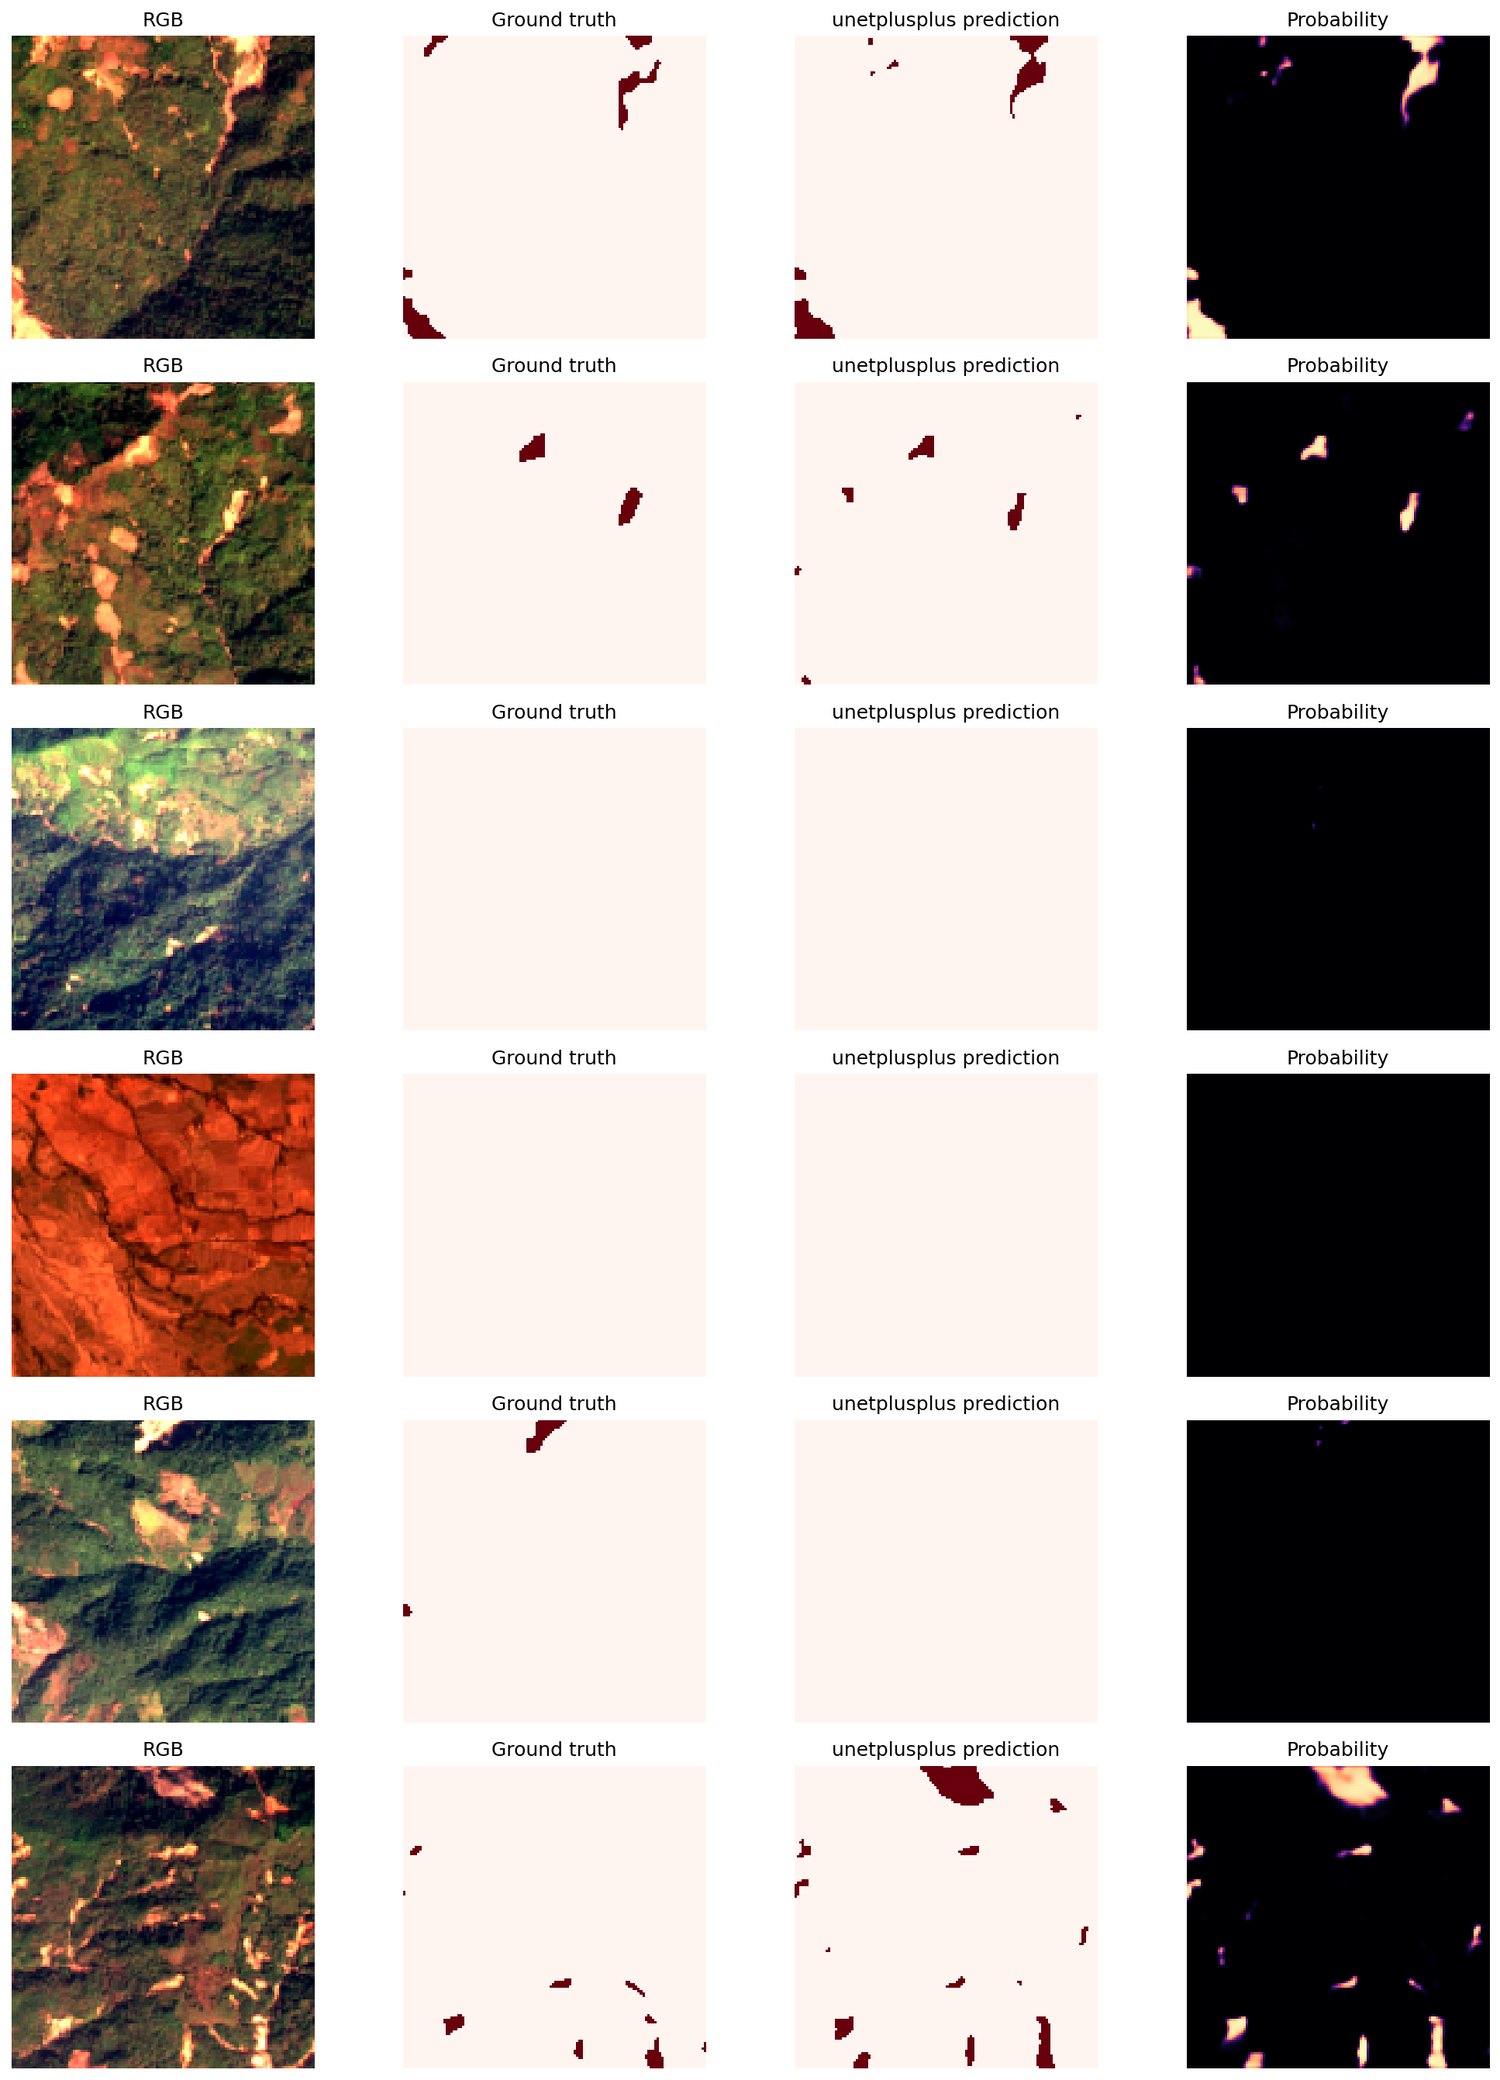
The winning U-Net++ model on held-out validation patches: input imagery, expert ground truth, model prediction and its probability field, side by side.

Grid of validation patches comparing satellite input, ground truth, U-Net++ prediction and probability heatmap
U-Net++ qualitative results on six random validation patches (RGB · ground truth · prediction · probability).

Explainable AI

Every alert explains itself.

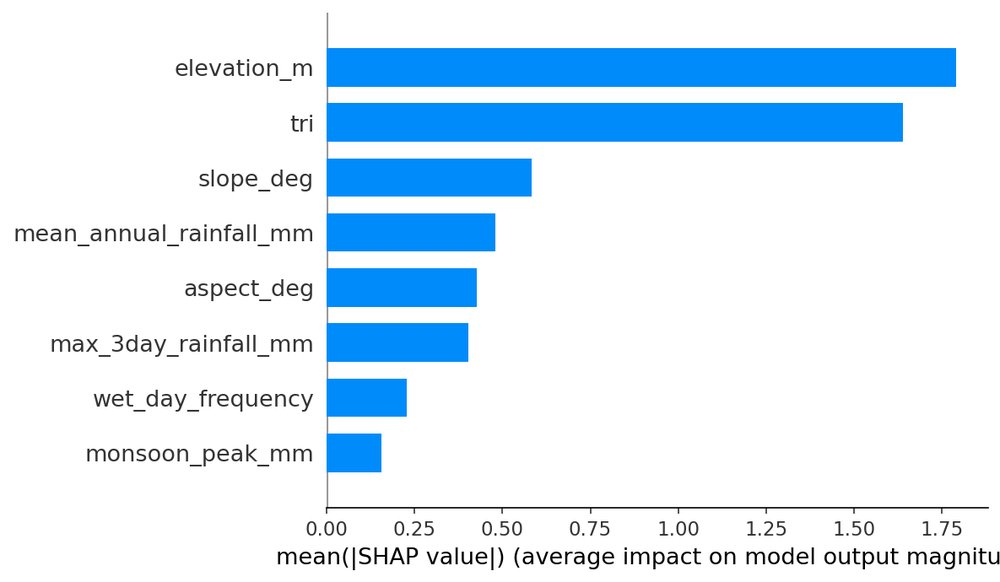
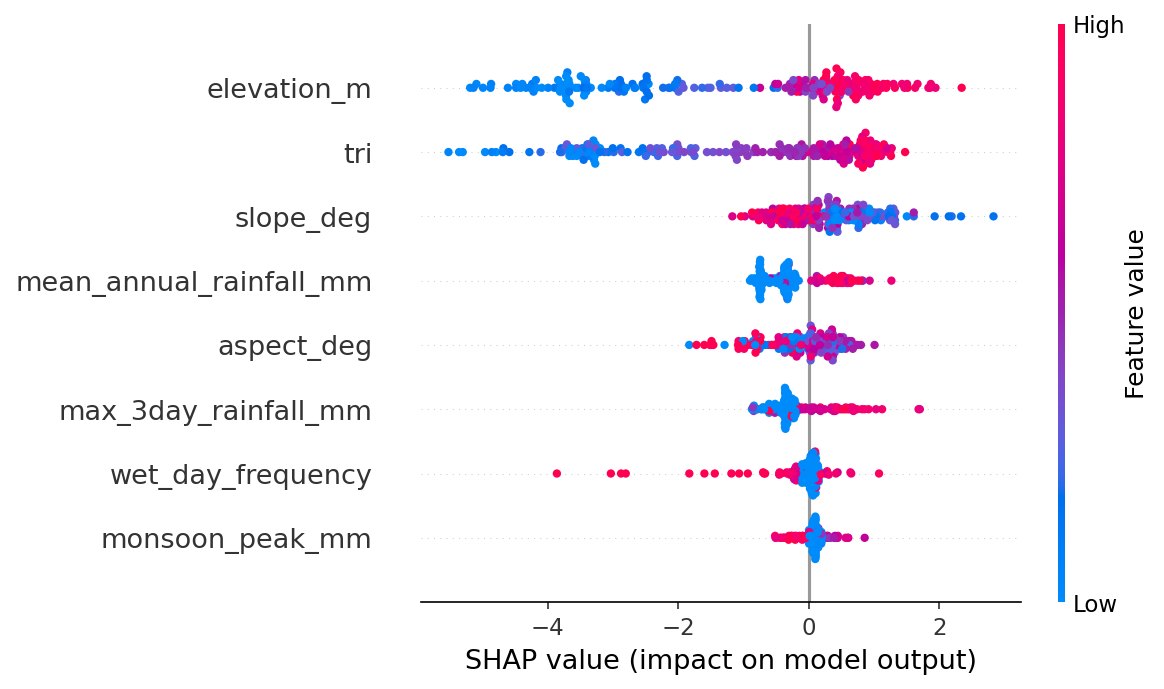
A risk score no one can interrogate is a risk score no district officer will act on. Three complementary tools open the black box: SHAP names the drivers, Grad-CAM shows where the vision model looked, and MC-Dropout reports how sure the model is — pixel by pixel.

Why it works — landslide sites live in a different climate

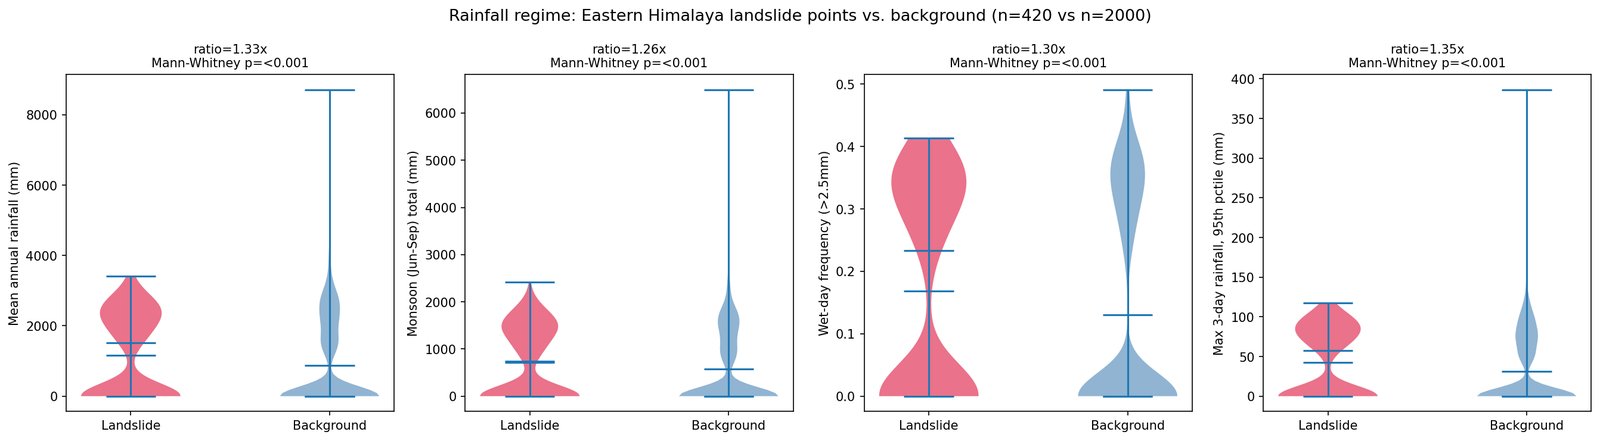
Violin plots comparing four rainfall metrics at landslide sites versus background locations
Four rainfall metrics, landslide sites (red) vs. 2,000 background points (blue), computed from 26 years of IMD data. Every gap is significant at p < 0.001.
+33%annual rainfall at landslide sites
29.4° vs 20.5°mean slope, landslide vs. background
p < 0.001on every metric (Mann–Whitney U)

What the model weighs, and which way

Where it looked, and how sure it was

Try it yourself

You are the district authority. Set the alert threshold.

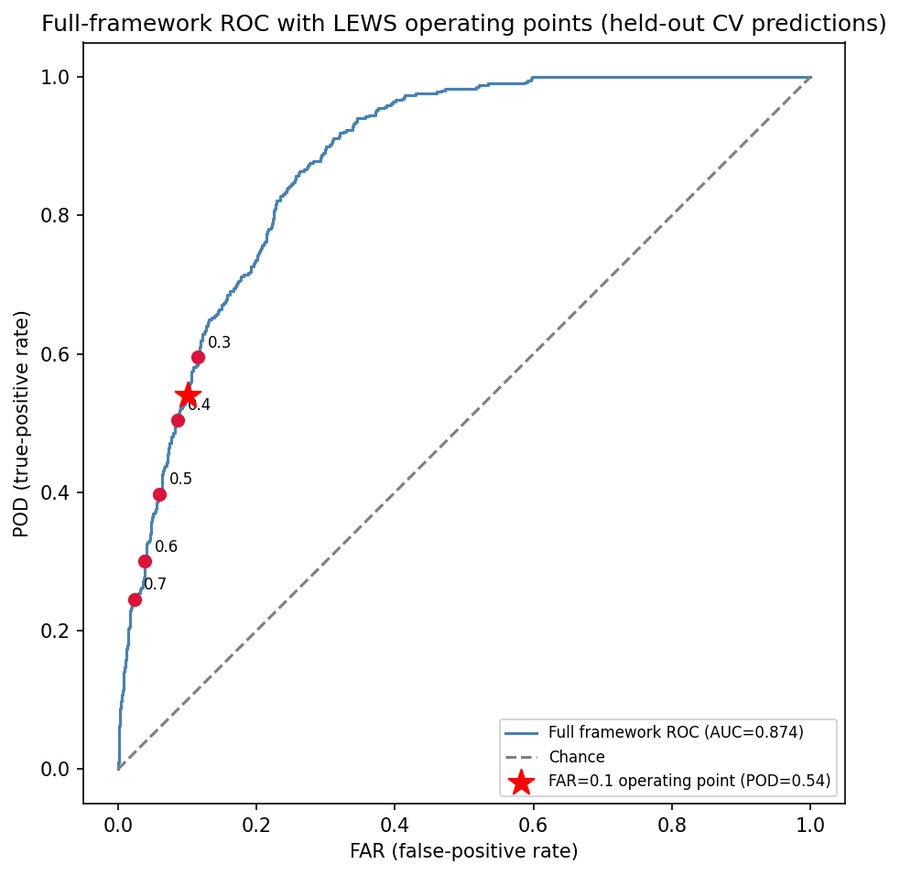
There is no single "right" setting — sensitivity is bought with false alarms. That trade-off is a policy choice, and this framework puts it explicitly in human hands. Drag the slider.

0.40
54%of known landslide sites detected (POD)
10%of safe locations falsely flagged (FAR)

ROC curve of the full framework with operating points marked, AUC 0.874
Full-framework ROC on held-out cross-validated predictions (AUC 0.874). The slider walks along this curve.

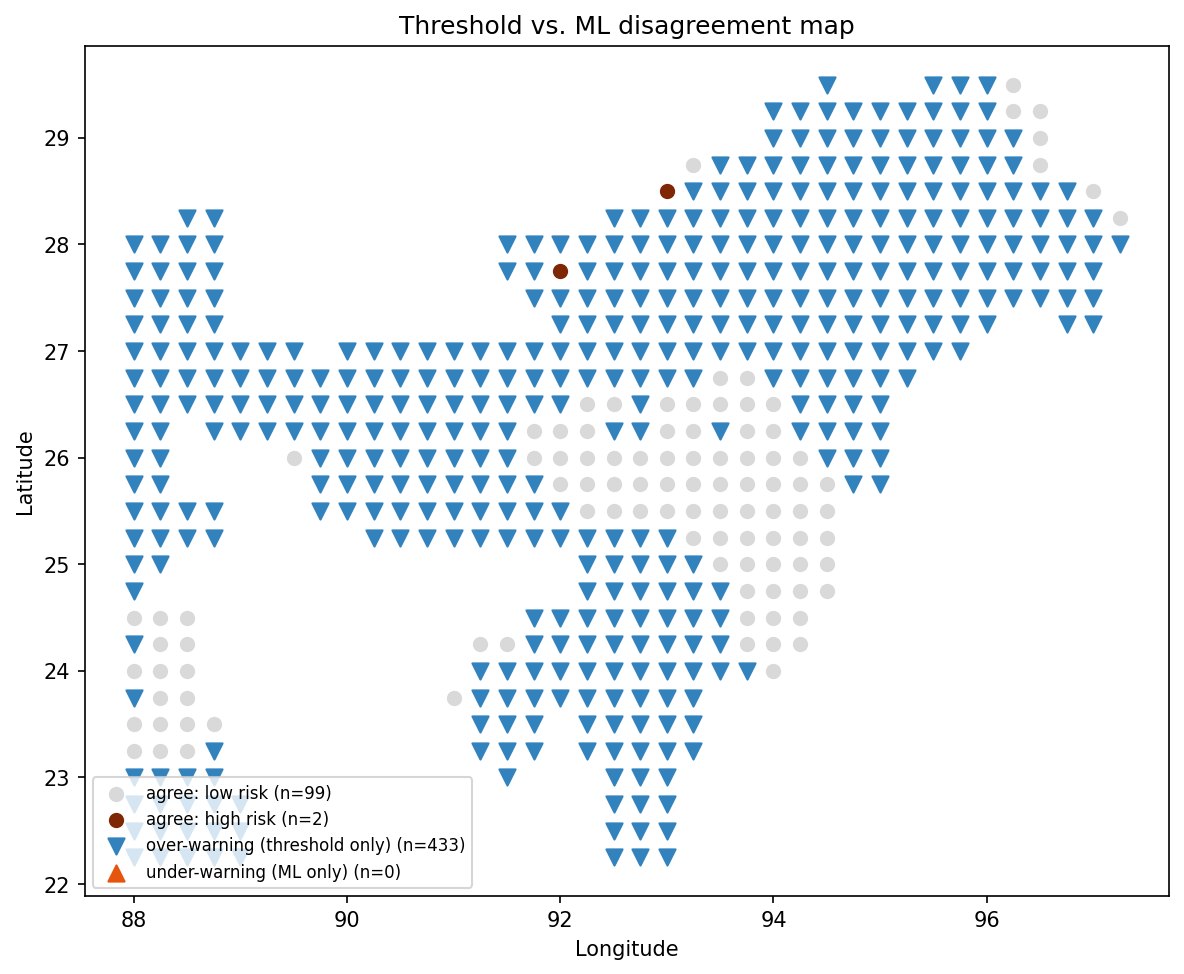
Where the classical threshold breaks down

The all-India rainfall threshold fires on most days across this hyper-humid belt — the terrain model is what restores discrimination.

Map contrasting where the national rainfall threshold over-warns against terrain-based ML susceptibility
Threshold vs. ML disagreement — blue where the national threshold over-warns; the terrain-based model concentrates alarms where slopes are genuinely dangerous.

Honesty section

What this is not — and what comes next.

Locations, not dates

The inventory records where landslides happened but not when — so this validation is spatial. Forecasting the day of failure needs dated events.

A framework, not a deployment

Everything here runs on one laptop with free data. An operational system needs institutions, telemetry and maintained pipelines.

Take it with you

Presentation, paper, poster & code.

Everything behind this project is open. Seminar materials will be linked here for attendees — scan, download, reproduce.

Presentation

The seminar slide deck — the full story in 12 slides, with the QR code that points here.

Coming soon at the seminar

Full paper

Methods, datasets, benchmarks and the honest cross-validated evaluation, in full.

Coming soon on request

Poster

The one-page visual summary designed for the conference poster session.

Coming soon at the seminar

Source code

The full reproducible pipeline — every stage, from raw data audit to the final maps.

Repository on request

About

The work, and who built it.

Akash Nath
B.Tech, Computer Science & Engineering
  • InstitutionAssam University, Silchar
  • DepartmentComputer Science & Engineering
  • ConferenceNational Seminar — Role of the Himalaya in Achieving the Vision of Viksit Bharat 2047
  • ThemeDisaster Risk Reduction & Environmental Governance
  • Dates24–25 July 2026

This is a proof of concept with a deliberately provocative premise: that meaningful landslide early warning for the Eastern Himalaya can be built today from free public data on a single laptop — no supercomputer, no proprietary feeds.

It is offered not as a finished product but as an invitation — to State Disaster Management Authorities, NESAC, and the research community — to pilot, critique and extend it toward an operational system for the region.

100% open dataESA · NASA · IMD · Zenodo
Consumer laptopno GPU cluster required